Dairy Upgrades
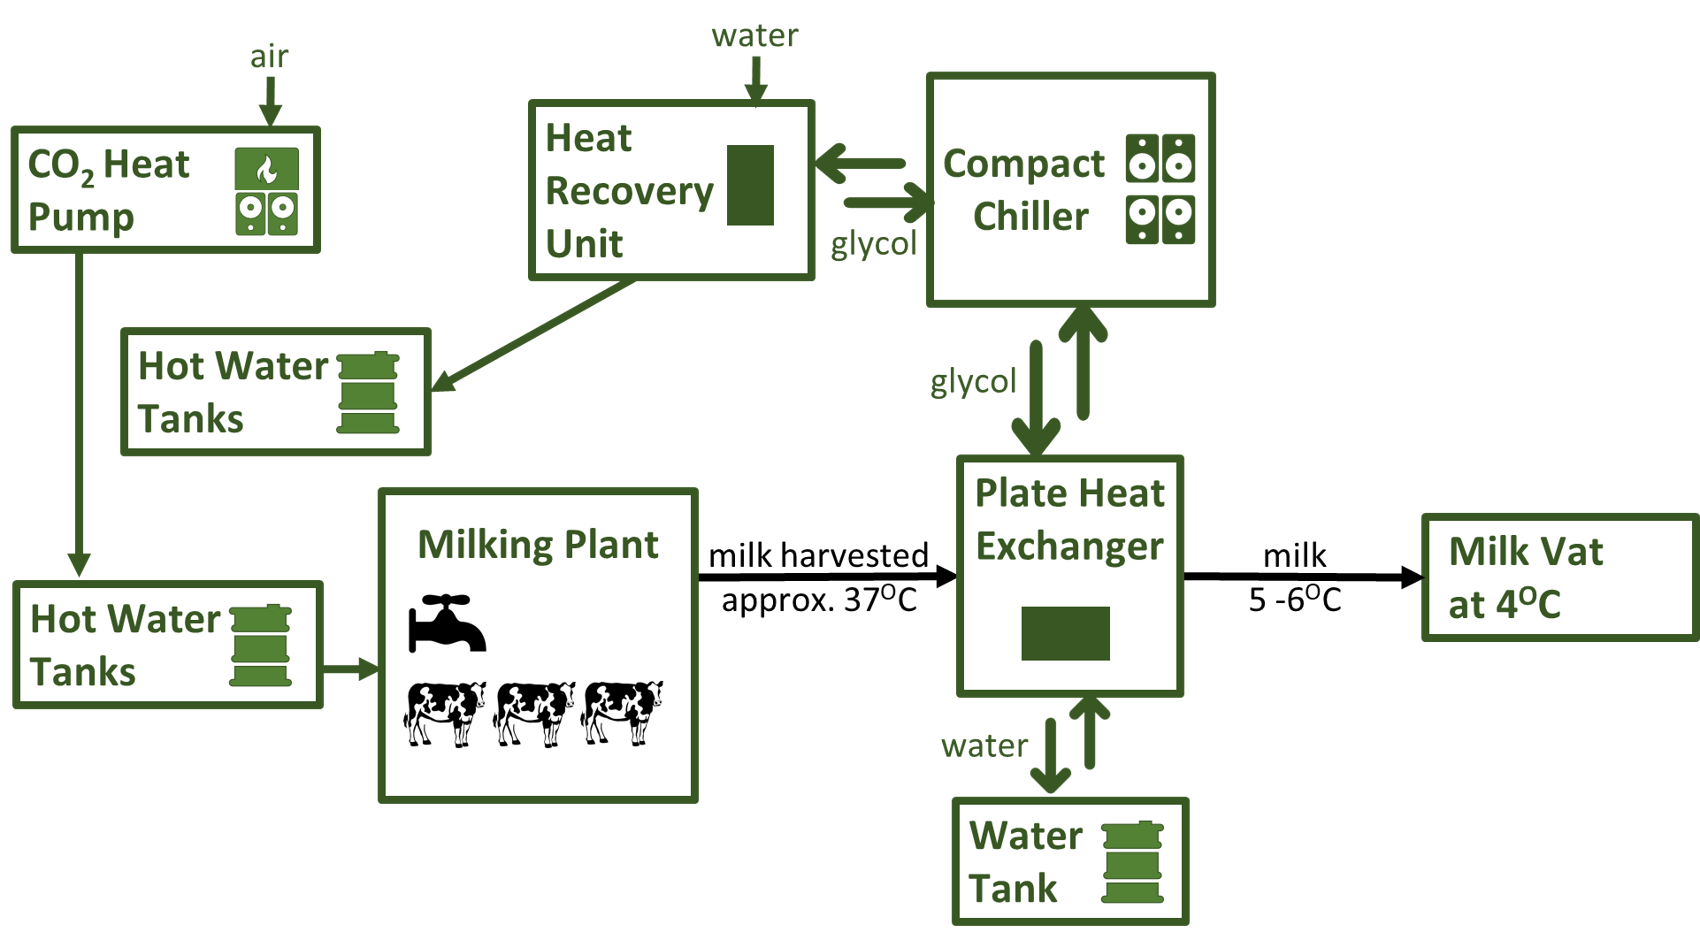
Following an on-farm energy assessment at the Ellinbank SmartFarm, a new compact chiller and CO2 heat pump were installed to improve the energy efficiency of milk harvesting processes in the dairy.
The top chart above shows the dairy’s energy demand in real time (kW) throughout the day.
The chart below it shows the energy demand by the chiller at the same time. The chiller’s energy use is a small portion of the dairy’s total energy demand. This is shown by the scale to the left hand side of each chart, with the chiller’s chart having a scale of smaller numbers.
The top chart above shows the dairy’s total energy use (kWh) each day for the most recent 30-31 days.
The chart below it shows the daily energy use by the chiller. The chiller’s energy use is a small portion of the dairy’s total energy demand. This is shown by the scale to the left hand side of each chart, with the chiller having a scale of smaller numbers.
The top chart above shows the monthly totals for the dairy’s energy use (kWh).
The chart below it shows the monthly amount of energy use by the chiller. The chiller’s energy use is a small portion of the dairy’s total energy demand. This is shown by the scale to the left hand side of each chart, with the chiller having a scale of smaller numbers.
Milk Production Monitoring
Milk is measured each morning and afternoon milking, as litres in the vat that goes to the factory.
The daily totals of factory milk litres are displayed here.
At mid-November 2021, there were 436 milkers.
Milk Production Monitoring
Milk is measured each morning and afternoon milking, as litres in the vat that goes to the factory.
The monthly totals of factory milk litres are displayed here.
At mid-November 2021, there were 436 milkers.